Sales & profit analytics
Where do your sales come from, how much do fees and shipping take, and how much is left in the end? Check it with numbers, not gut feeling.
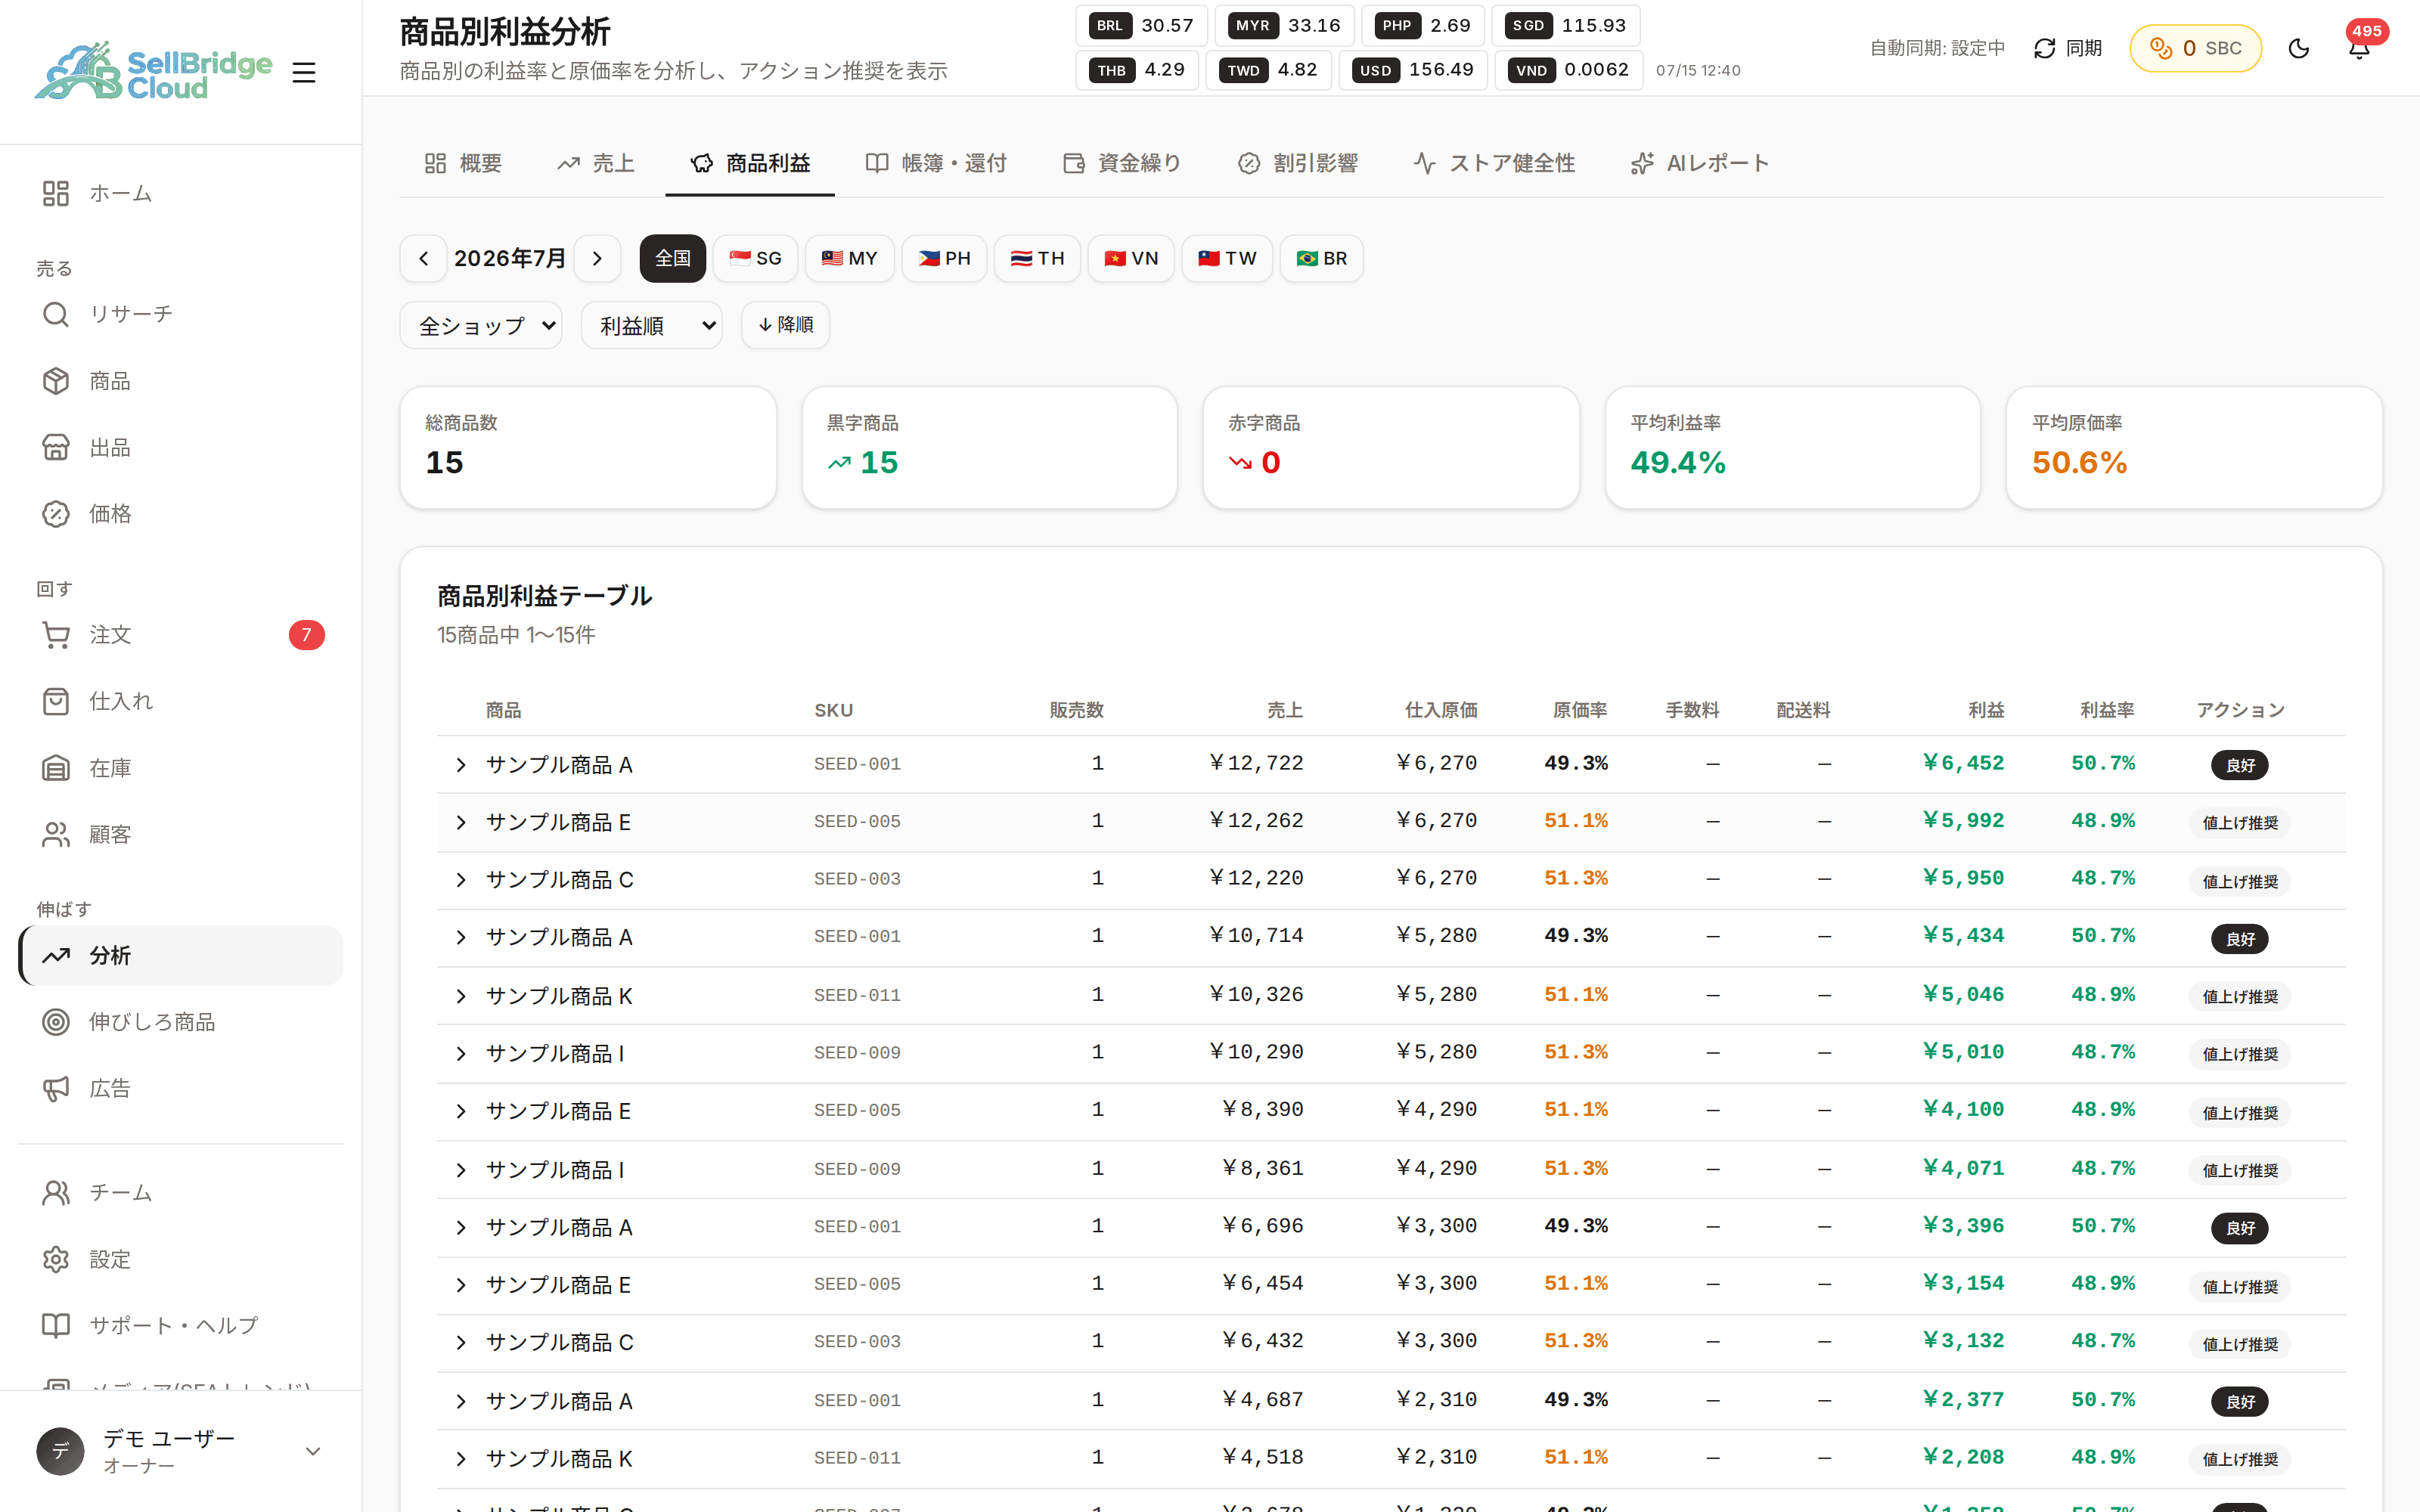
See “selling well” and “making money” separately
The products with the biggest sales are not always the ones that leave the most profit. SellBridge totals profit per product after fees, shipping and purchase cost, so you can find products that are actually close to a loss — something a sales ranking won’t show you.
- See sales and profit separately for each product
- Totals are calculated after fees, shipping and purchase cost
- Filter and compare by country and period
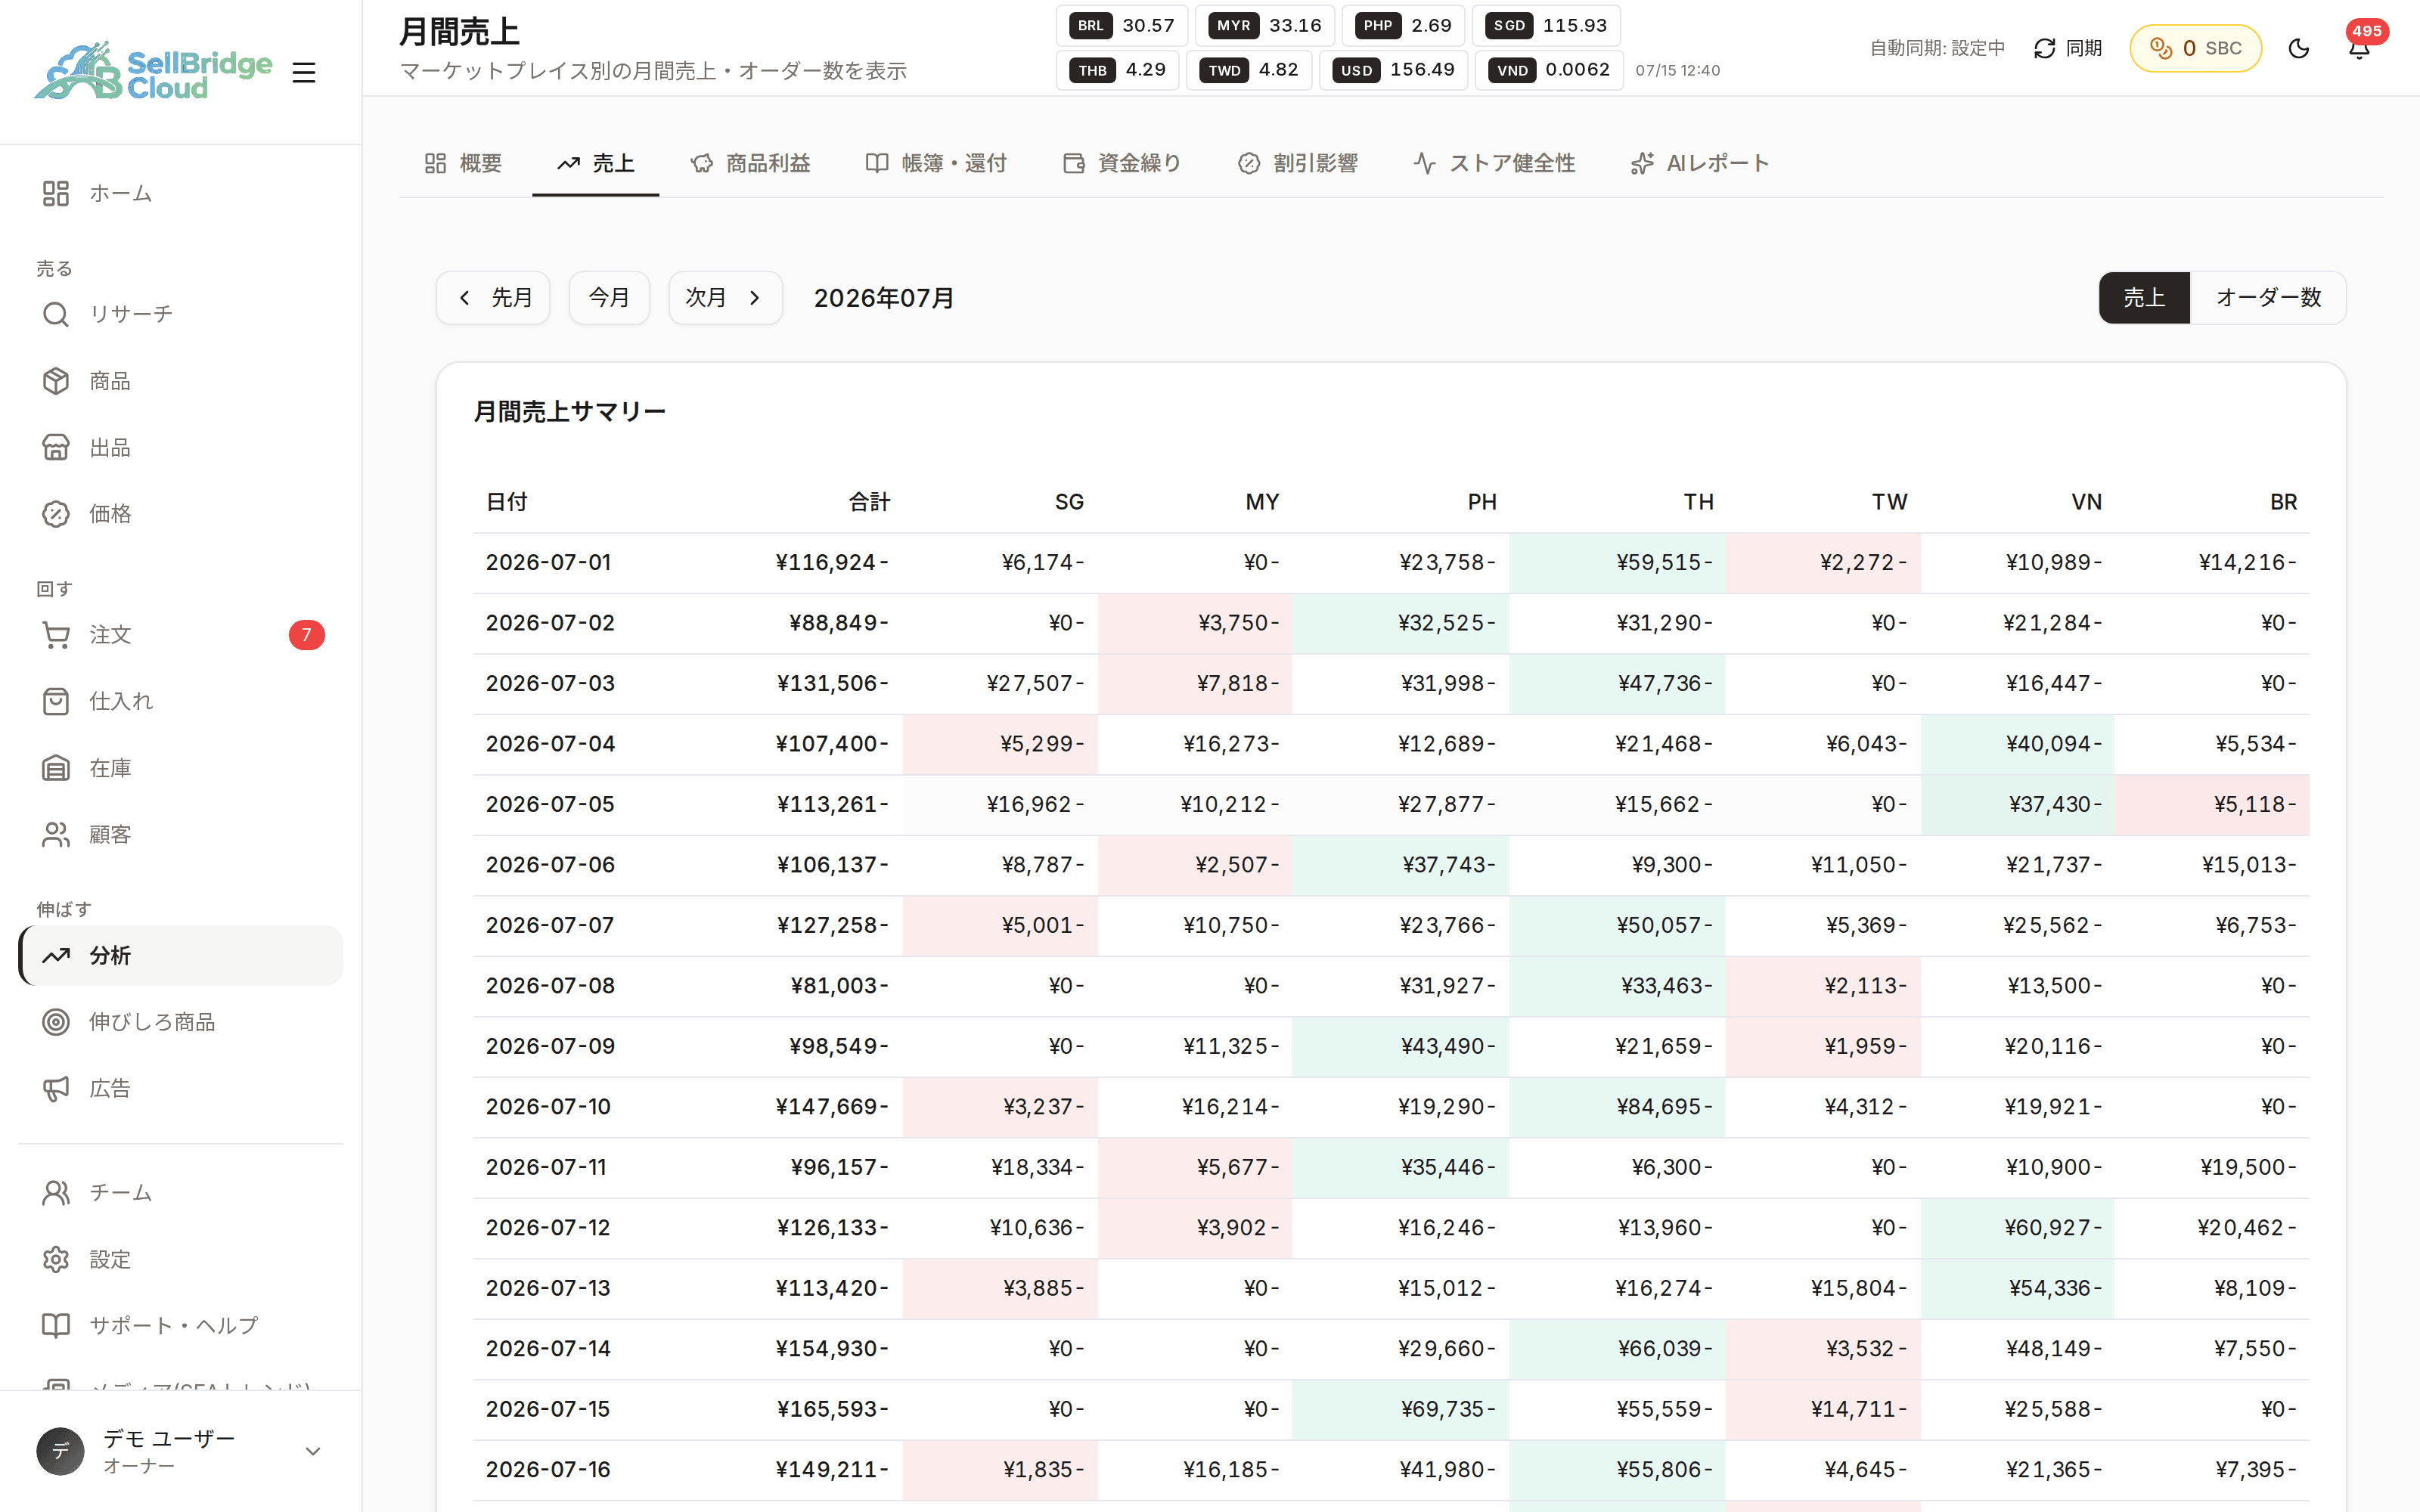
Monthly trends become material for your reviews
See monthly sales and profit side by side. You can tell at a glance what changed from the previous month, which makes it a starting point for checking the effect of your actions or finding the cause of a dip.
- See monthly sales, order count and profit side by side
- Track changes in the share of each country
- Higher plans support export to CSV and Excel
Availability by plan
Monthly sales and store health are available from the Basic plan; detailed analysis such as cash flow and profit by product is available from the Standard plan.
| Feature | Free | Basic | Standard | Premium |
|---|---|---|---|---|
| Monthly sales | − | ○ | ○ | ○ |
| Store performance | − | ○ | ○ | ○ |
| Profit by product & cash flow analysis | − | − | ○ | ○ |
| Export to CSV | − | ○ | ○ | ○ |
| Export to Excel | − | − | ○ | ○ |
| PDF report | − | − | − | ○ |
“−” means the feature is not available on that plan. See the pricing page for the latest prices and plan details.
Frequently asked questions
- How is profit calculated?
- We subtract marketplace fees, shipping costs, purchase costs and so on from sales. Registering your purchase information gives you a more accurate profit figure.
- Can I export the analysis?
- Export to CSV and Excel is supported depending on your plan. See the plan table for the supported formats.
- Can I compare countries?
- You can filter and compare sales and profit by the country of each connected store.
More features
Combine SellBridge features to connect your entire cross-border operation.
Make cross-border operations simpler.
Start on the Free plan — no credit card required.